Tracking NYC's Coronavirus Case Count
It’s easy enough to find current live stats for Coronavirus cases at the country or even state level, but it’s tougher to find for a particular city - and even more time-consuming to dig up the historical numbers. I did some legwork and caught up on all the NYC reporting, collecting it in a spreadsheet and adding some growth calculations.
Scroll around the embedded spreadsheet and graphs just below, or better yet, visit the Google Sheet itself for a better experience. Further down the page I explain a bit about what all this (may) mean.
You can find the full sheet here
What this might tell us
Disclaimer: I am not an epidemiologist, nor a statistician. Just an interested individual with an understanding of the basics.
I was inspired by a 3Blue1Brown video on exponential growth and epidemics in the context of the current Coronavirus pandemic. He does a great job explaining the math there and I became interested in applying these ideas, live, in a way that might help me wrap my head around what the fuck is going on. Maybe the illusion of control and explanation is comforting during a time when nothing makes sense.
The important details, for any readers interested in the significance of these charts but not willing to watch the linked video, are as follows:
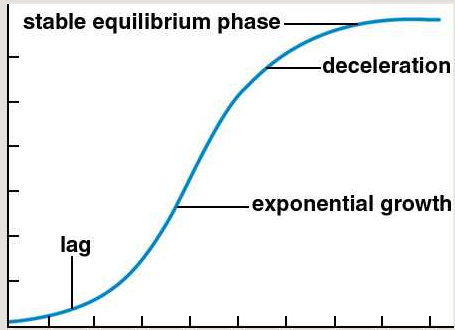
- A logistic function is often used to model the spread of disease.
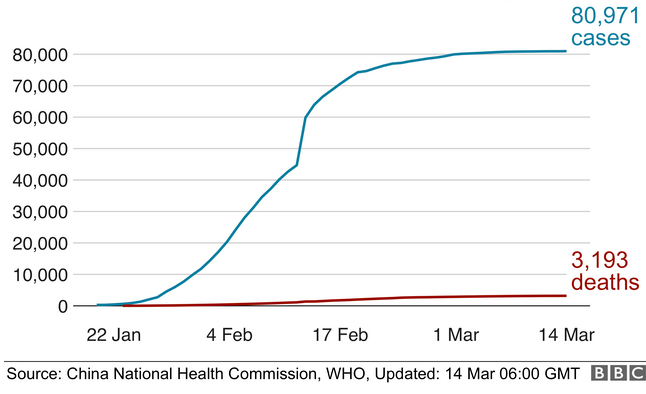
- Take a look at a graph from China’s (slowing) cases and compare it to the above. A decent-enough fit to be worth paying attention to.
- In such a function, two important sections to notice are the exponential growth phase and the deceleration phase. Between these two, there is an inflection point where rapid, exponential growth stops and a gradual slowdown begins.
- During the exponential growth phase, the growth factor will be larger than 1.0.
- The inflection point will see a growth factor of exactly 1.0.
- A growth factor less than 1.0 indicates the leveling-off of the curve.
In the real-world it won’t all be that exact, but in general, lingering near these various growth factors for stretches of time might be indicative of something.
Expectations
The upshot of this for me is about setting proper expectations, grounded in something other than media shouting. When you look at the numbers coming out of China and Italy and then compare them to figures in the US and our various cities you can (to some degree) draw your own conclusions (you should still listen to the experts) about what’s going on.
There is clearly a long road ahead, but there is an end in sight. Perhaps having a beat up, hand-drawn, maybe-wrong map for that road will help you out a little.